No Data2026 Fleet Maintenance Costs in KSA
Your ultimate guide to controlling fleet expenses

Fleet Maintenance Cost
in Saudi Arabia 2026
Real operational averages from the Saudi market — a complete breakdown of every cost line, hidden waste that never appears on any invoice, and a practical reduction plan
💡 Bottom Line for Decision Makers (CFO / CEO)
Saudi companies lose an average of 18% of fleet profits to emergency repairs that could have been avoided entirely.
Digital maintenance documentation is no longer optional — it's a prerequisite for tenders and major projects under Saudi regulations.
Every SAR invested in preventive maintenance can save 4.2 SAR in total operating costs by year-end.
Real Averages: What Does Fleet Maintenance Actually Cost?
Before any strategic decision, you need benchmark figures — not general estimates. Below are average annual cost ranges from the Saudi market:
| Vehicle / Equipment Type | Annual Maintenance (SAR) | Annual Fuel Cost (SAR) | Total Annual Operating Cost |
|---|---|---|---|
| Executive / Staff Car | 8,000 – 12,000 | 9,600 – 14,400 | 17,600 – 26,400 |
| Service Pickup Truck | 10,000 – 16,000 | 14,400 – 21,600 | 24,400 – 37,600 |
| Light Truck (1–5 tons) | 14,000 – 22,000 | 18,000 – 28,800 | 32,000 – 50,800 |
| Heavy Truck (10+ tons) | 28,000 – 45,000 | 36,000 – 60,000 | 64,000 – 105,000 |
| Excavator / Construction Equipment | 35,000 – 70,000 | 30,000 – 55,000 | 65,000 – 125,000 |
| Mixed Fleet (25 units) | Estimated total average | 750,000 – 1,400,000 | |
* Fleet age 3–7 years, moderate daily usage, mixed operating environment. Figures vary based on your company's specific conditions.
Enter your vehicle count and types to get an accurate annual cost estimate — free and instant.
The Four Major Cost Categories, Broken Down
The total bill breaks down across four categories — each with a different nature and a different savings opportunity:
Tires & Wheels
The highest single cost in Saudi conditions. Heat destroys tires from the inside before visible tread wear appears on the outside.
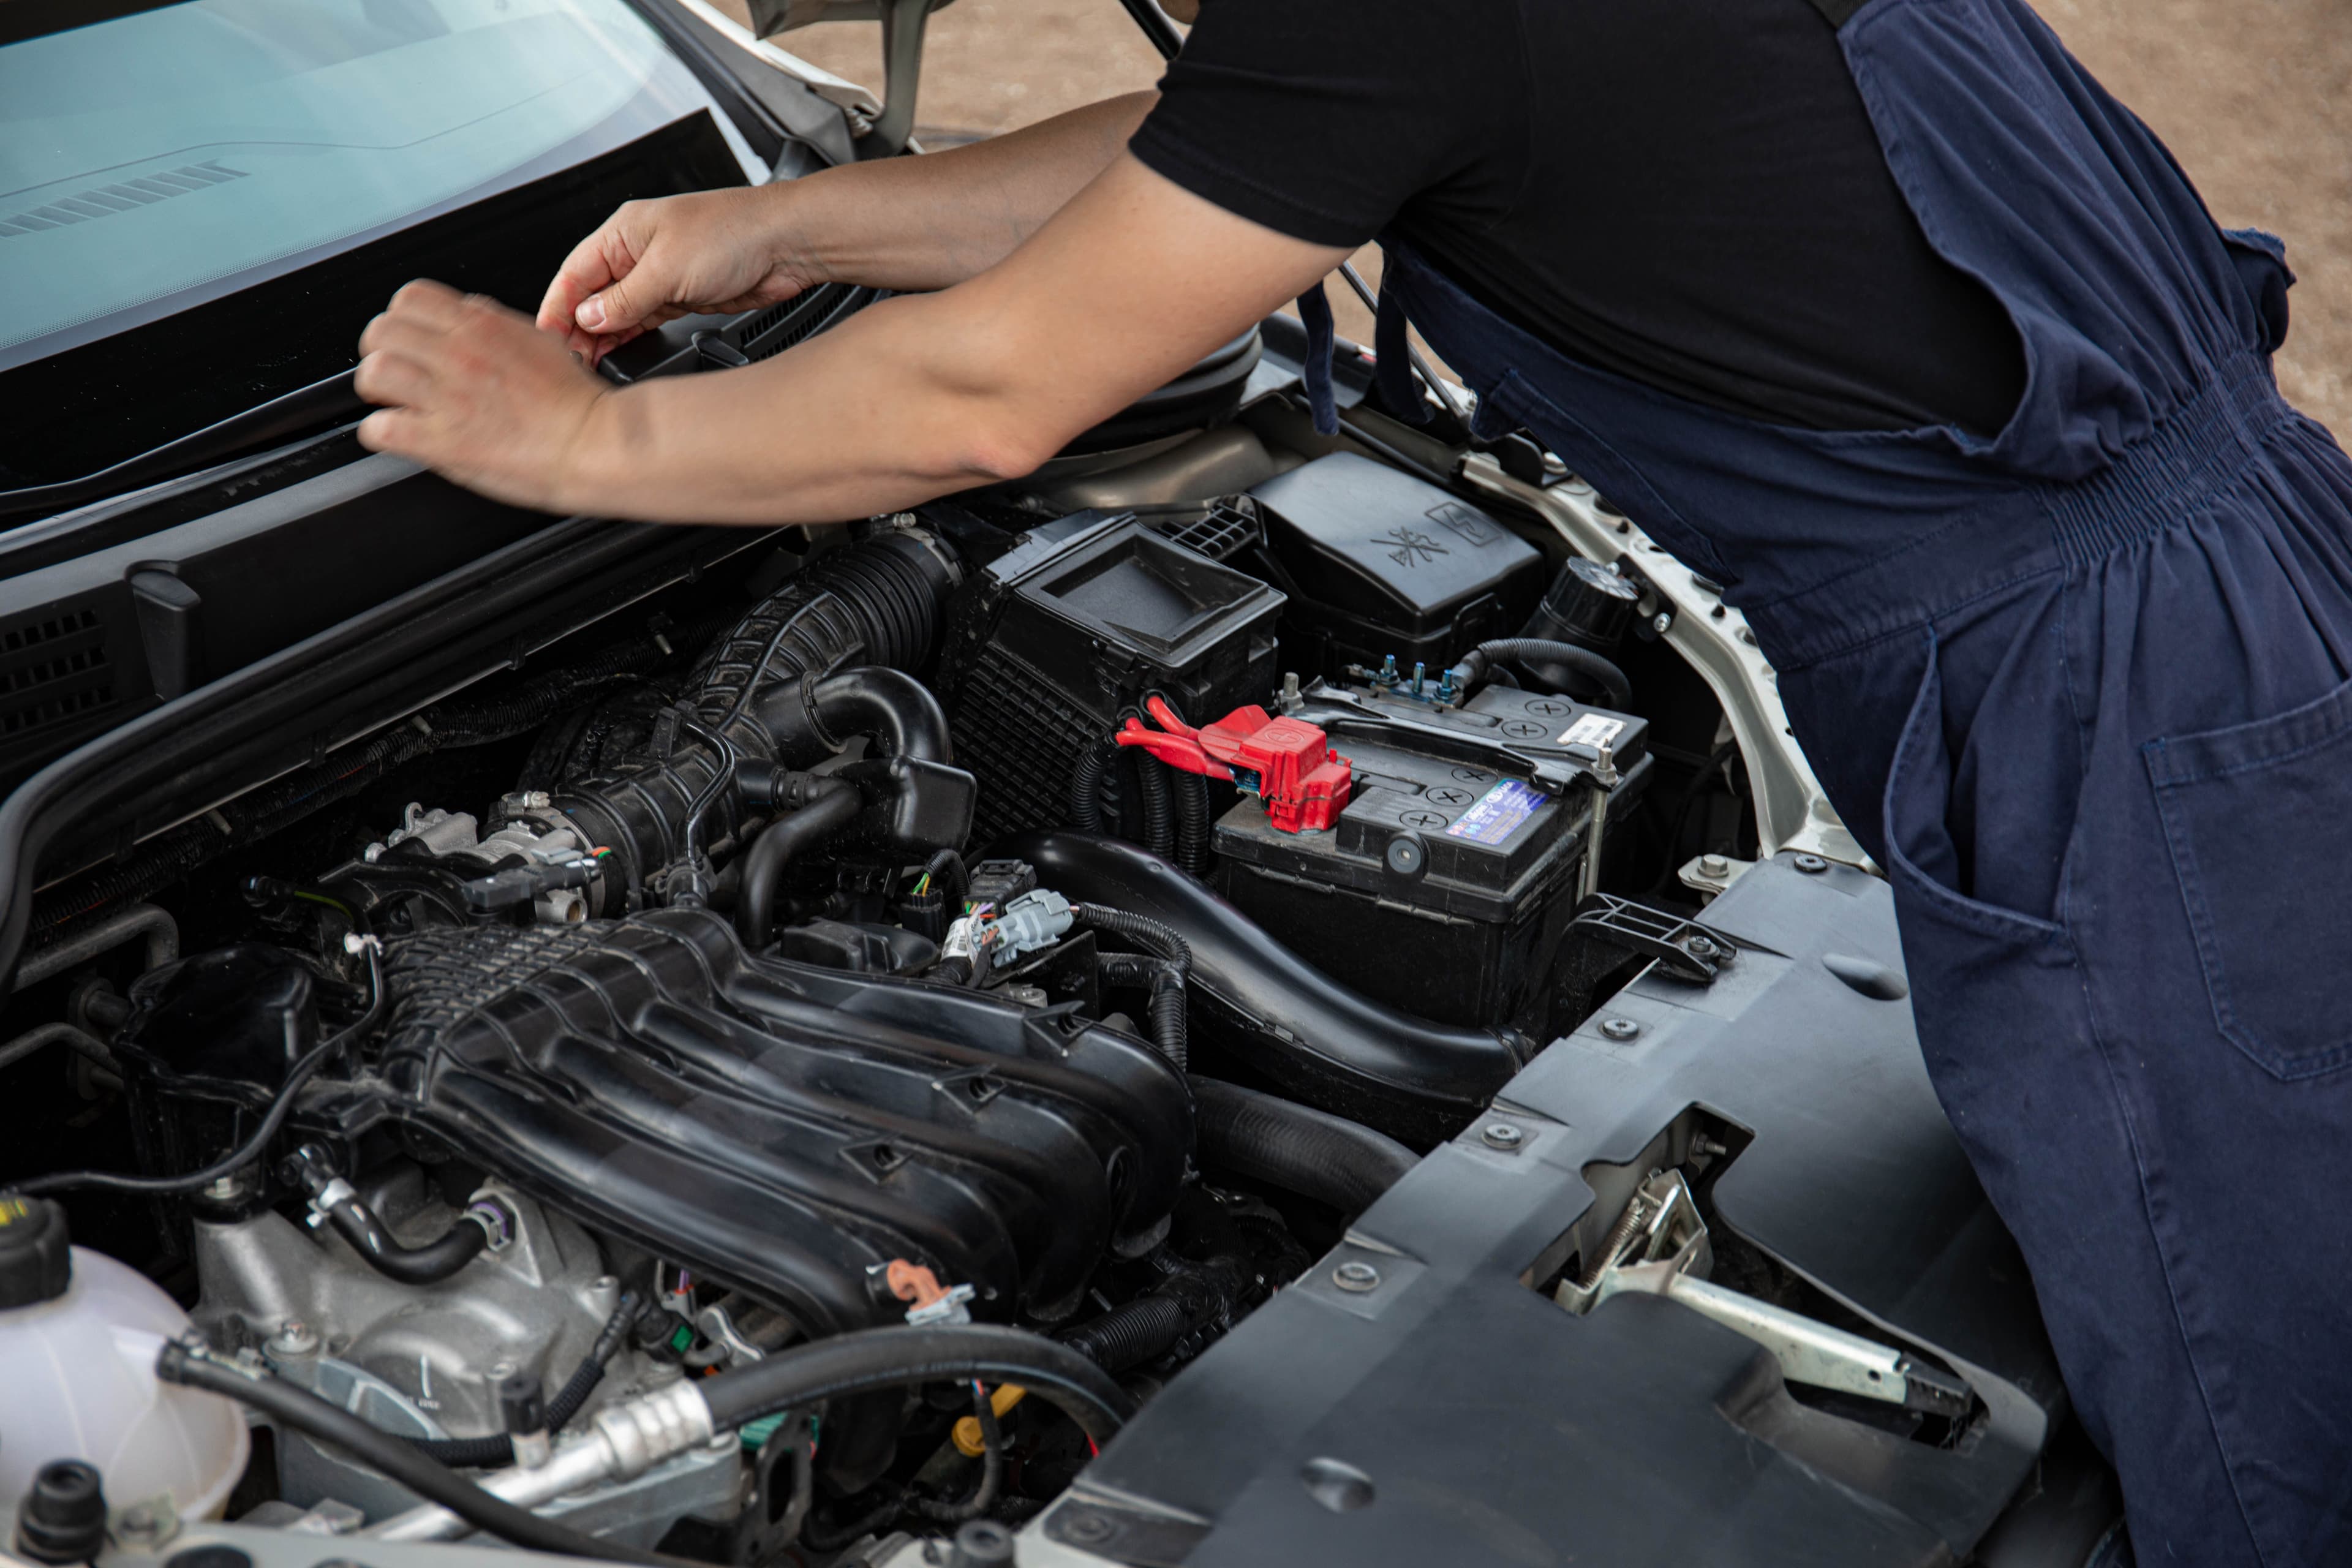
Engine & AC System
Major engine failures take vehicles off the road for weeks. In Saudi Arabia, the AC is a daily operational necessity, not a luxury.
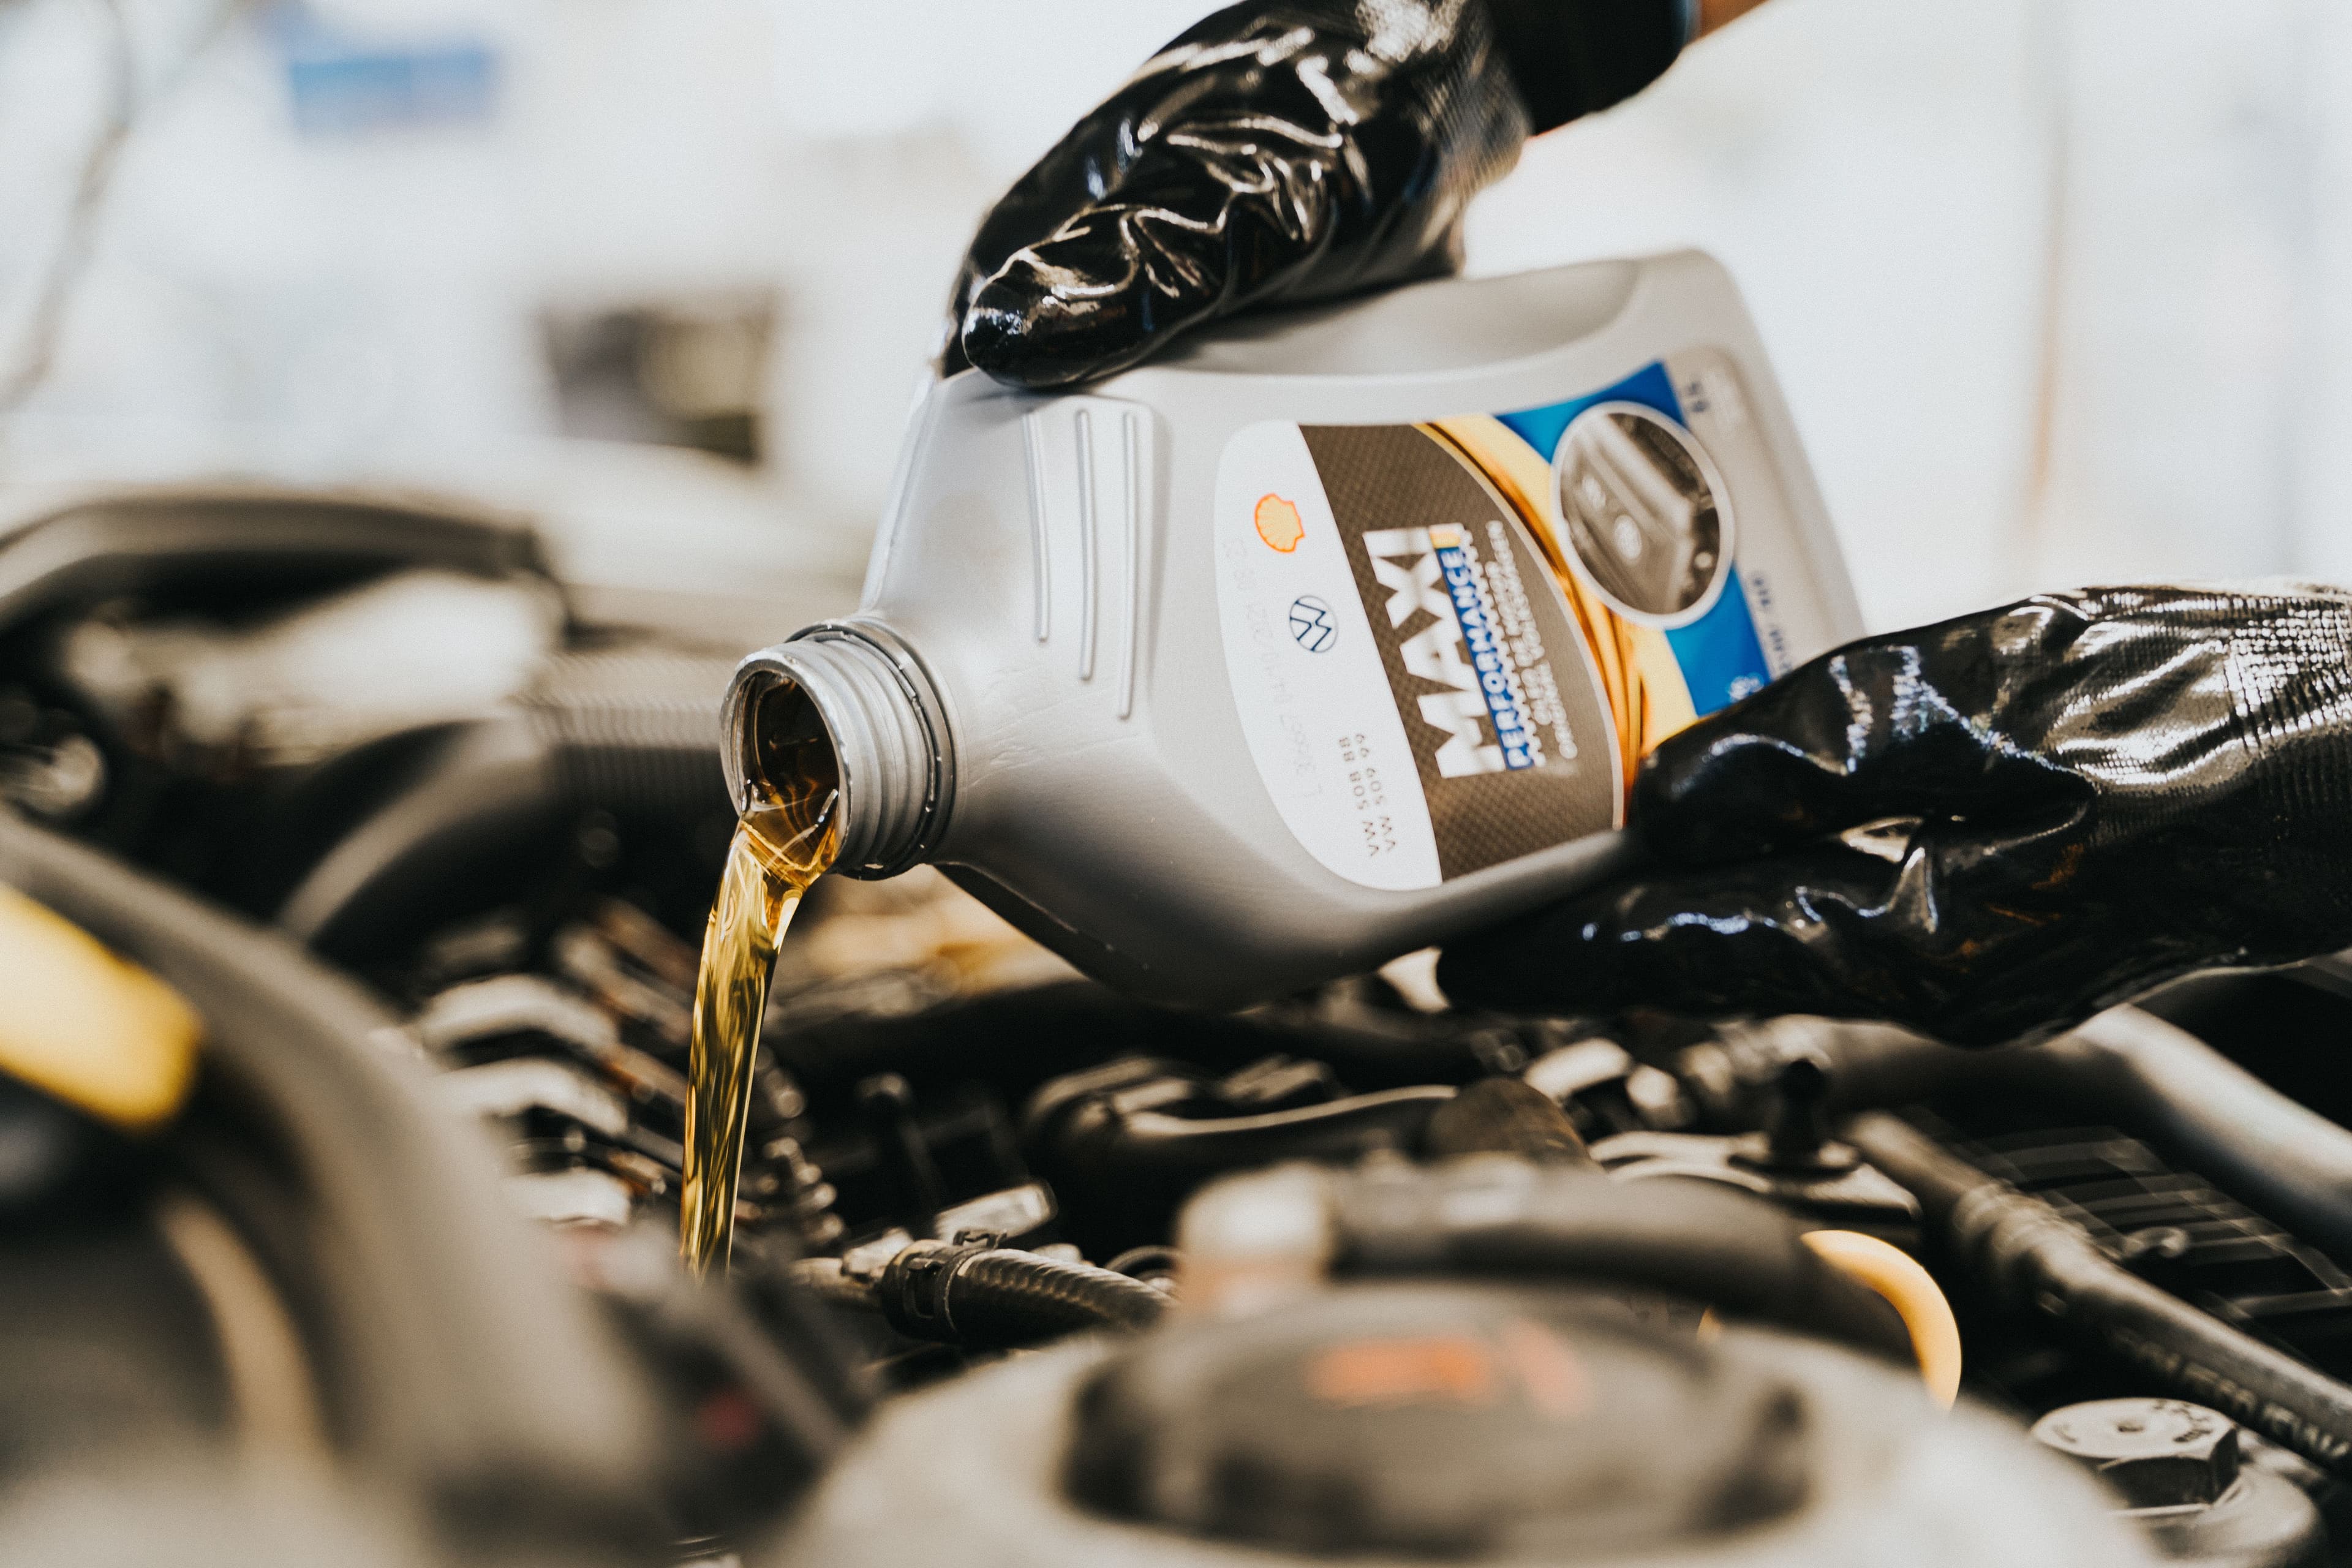
Oils, Filters & Fluids
Saudi dust clogs filters at 2–3x the rate of global recommendations. Correct scheduling protects the engine and extends its life.
Emergency Repairs & Other
The most avoidable category. Most of it results from delayed maintenance or poor driver behavior.
Hidden Waste — What Never Shows Up on Invoices
The numbers in your cost table are only what you can see. The real waste usually appears nowhere on any invoice:
- Repeat Repairs: A vehicle not properly fixed returns to the workshop with the same problem within weeks — with no documentation linking the two visits
- Untracked Fuel Waste: Without digital monitoring, a portion of your fuel bill never actually reaches the vehicles
- Excess Spare Parts: Purchasing without historical data creates dead inventory that quietly drains cash flow
- Wrong-Time Maintenance: Replacing a tire too early or after it's already damaged — both are losses
- Management Time: Manual daily follow-up consumes hours and decisions that could go elsewhere
The Saudi Climate Factor: The Silent Multiplier
Companies that import global maintenance standards and apply them in Saudi Arabia without adjustment are making a costly mistake.
Riyadh & Central Region
- Heavy dust clogs filters at double rate
- Dry heat destroys tires from inside
- Engine overheating risk is higher
- Engine cooling — top priority
Jeddah & Eastern Region
- Salt air accelerates corrosion
- Humidity corrodes electrical connections
- More frequent AC maintenance required
- Regular wheel hub inspection needed
Mountain Regions (South)
- Slopes multiply brake wear and stress
- Rough terrain drains suspension systems
- Shorter tire lifespan
- Transmission inspection is high priority
📍 Maintenance Map by Region:
Double focus on filtration systems and cooling due to sandstorms and dry heat.
Top priority: combating rust and salt corrosion in electrical components and undercarriage.
Intensive periodic inspection of brake and suspension systems due to mountain gradient stress.
| Maintenance Item | Global Standard | Saudi Recommendation | Reason for Difference |
|---|---|---|---|
| Engine Oil Change | Every 10,000 km | Every 5,000–7,000 km | Heat breaks down oil faster |
| Tire Inspection | Monthly | Weekly in summer | 50°C+ raises internal pressure |
| Air Filter Replacement | Every 15,000 km | Every 7,000–10,000 km | Dust and sand clog it twice as fast |
| AC Maintenance | Annually | Every 6 months | Runs 10+ hours daily continuously |
| Battery Health Check | Every 2 years | Annually | Heat reduces battery lifespan ~30% |
* Advisory schedule. Exact recommendations vary by vehicle type and actual usage conditions.
Legal Liability & Penalties for Negligence
Maintenance is not just an operational decision — it is a legal obligation in the Kingdom with direct consequences for non-compliance:
Case Study: A 40-Vehicle Contractor in Riyadh
A scenario modeled on a mid-size construction company — figures are estimates representing a realistic range:
5-Step Cost Reduction Plan
Real reduction comes from a data-driven methodology built on your own company's numbers:
Measure Reality First — Accurate Data for Every Vehicle
You can't improve what you don't measure. Start by consolidating every vehicle's maintenance history in one place — actual cost, breakdown dates, repeat repair frequency.
⏱️ Saves 3–4 admin hours daily 💡 Fleet Plus collects data automaticallyShift from Reactive to Predictive Maintenance
Reactive maintenance (after breakdown) is the most expensive. Preventive reduces cost by 20–30%. Predictive anticipates failures before they happen — with potential impact up to 40%.
💡 Estimated savings: 20–40% on major repairsAdapt the Maintenance Schedule to Saudi Conditions
Replace manufacturer recommendations with an adjusted schedule: oil every 5,000–7,000 km, weekly tire checks in summer.
💡 Estimated prevention of 60–70% of summer breakdownsMonitor Driver Behavior and Convert It Into Savings
Aggressive driving increases fuel consumption and accelerates tire wear. Automated reports give you a real-time picture of every driver.
⏱️ Eliminates weekly manual follow-up sessions 💡 Estimated savings: 12–18% on fuel and tiresAnalyze TCO and Make the Right Replacement Decision
Keeping a vehicle past its break-even point can cost more than replacing it. TCO analysis identifies when repair becomes a "guaranteed loss."
💡 Fleet Plus calculates TCO per vehicleReactive vs. Predictive Maintenance — A Numbers Comparison
Before & After — Operational Comparison
Book a live demo with our team — response within 48 hours.
Frequently Asked Questions
How much does truck maintenance cost in Saudi Arabia annually?
What is the recommended maintenance schedule for commercial trucks in Saudi Arabia?
How much does commercial vehicle maintenance cost annually in Saudi Arabia?
Does a fleet management system help with regulatory compliance?
Is preventive maintenance worth the cost?
Turn Your Fleet From a Cost Center Into a Profit Driver
Start with the step that makes sense for you — no commitment required.